Measuring our carbon footprint
Calculating the CO2 emissions of the .eco domain registry

When we committed to get to net zero, we knew that we needed to get a better understanding of our carbon footprint. Initially we looked around to find an assessor to help us measure our footprint, but the ones that we spoke with were pretty busy. Their advice was to start the work ourselves. This article lays out what we’ve learned in doing so, the approach we’ve taken and our assessed impact.
Please note that this is a preliminary evaluation that is based on a self-assessment. The results and methodology may change once we have had an auditor review our calculations.
Scoping our emissions
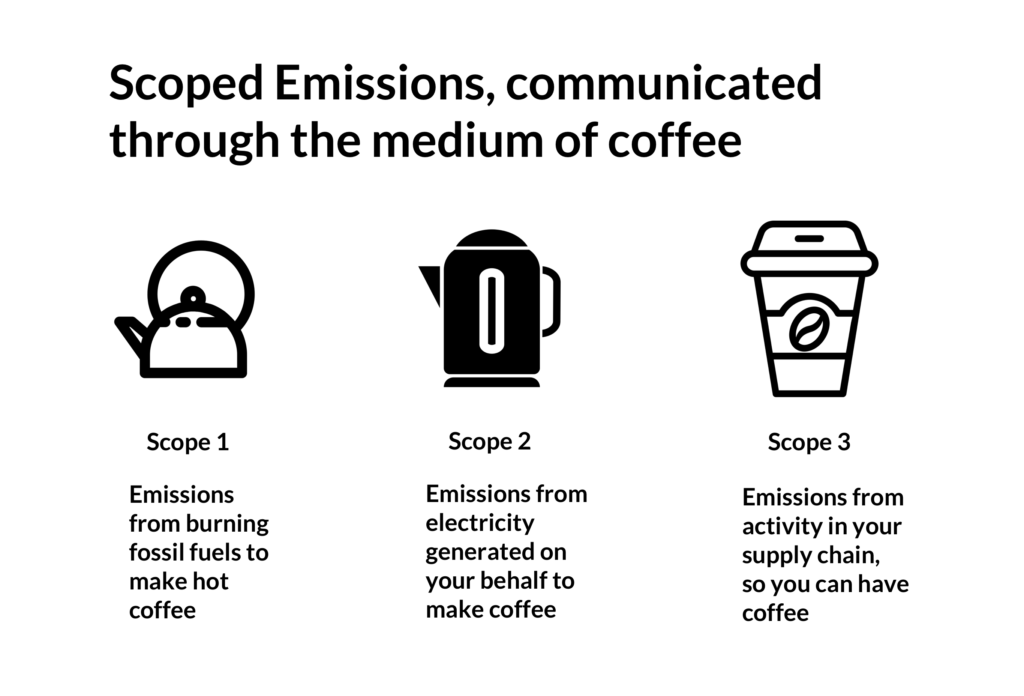
The typical approach to calculating an organization’s carbon footprint is to look at Scope I, II and III emissions.
- Scope I are direct emissions from our work
- Scope II are indirect emissions from generating the energy we use
- Scope III are indirect emissions produced by our supply chain and by our customers using our services
The Green Web Foundation does a nice job of explaining these scopes by using the example of a cup of coffee.
Operating a domain registry is not like a traditional business. We’re fully virtual - we don’t have a physical office. The goods that we produce (.eco domain names) are digital; making them does not generate any direct emissions. We use partners to operate the services that we use; there is not a lot that we run directly.
Basically, our Scope I and II emissions are more or less zero and all of our emissions would be classified as Scope III. What could be considered as included in Scope III is potentially quite broad. For this initial assessment, we have chosen to focus on the impact of the digital services that we use to run the .eco registry.
Big Room digital services
In operating the .eco domain registry, there are two main pieces of digital infrastructure that are run on our behalf by CIRA, the Canadian Internet Registration Authority:
- DNS: CIRA operates 19 points of presence (PoPs) around the world that respond to DNS requests any time someone looks up a .eco domain name.
- Registry service: manages the .eco root namespace, fielding requests from registrars whenever someone wants to buy or manage a .eco domain name.
In addition, there are four other web properties that we operate that we have included in scope:
- profiles.eco: one thing that makes .eco unique is that we are a community top-level domain. As part of joining the community, .eco domain holders need to create a .eco profile.
- go.eco: the main site for the .eco registry (along with our localized French and German sites)
- bigroom.eco: our corporate website
- ecolabelindex.com: we also operate the world’s largest registry of ecolabels
Calculation methodology
After reviewing a few different approaches for calculating the carbon footprint of websites and services, we decided to follow the Sustainable Web Design method. This method was put together by the companies behind websitecarbon.com and ecograder.com, and is supported by the Green Web Foundation.
There are several advantages of this method:
- It is quite comprehensive as it includes impacts extending from the data center through to the energy use of the device displaying the website
- It is adaptable. We can plug in specific data where we know it and use general industry metrics where we don’t.
- It is referenceable. Our results can be compared using publicly available services. While the results won’t be exactly the same — we use data that they don’t have access to — the results will at least be comparable.
- It is simple to understand and calculate. It uses a common measurement — gigabytes of data transmitted — as the basis of the calculation. This is a measurement that is relatively easy to obtain and it’s something that we have a degree of control over.
There are three main components to this model:
- Data center: the servers, databases and other data center infrastructure involved in hosting the website and serving traffic
- Network: the communication cables and networking equipment responsible for transmitting the website data to the user’s browser
- End user device: the mobile phone or computer that requested the data
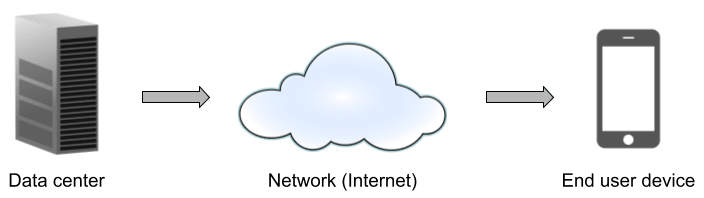
Each of these components requires electricity to operate. So the emissions generated to power these components can also be incorporated into this model. For example, if the data center is powered using 100% renewable energy that would have lower total emissions than for a data center powered using electricity from a coal or gas plant.
The model relies on a common metric where 1 gigabyte of data requires approximately 0.81 kilowatt hours (kWh) to serve, transmit and render. The 0.81 kWh is split among the components using some standard percentages:
- Data center: 14%
- Network: 15%
- Device: 52%
- Embodied carbon in the data center, network and device hardware: 19%
Any of these metrics could be adjusted based on more relevant data. But for the most part, we stuck to those proposed in the methodology.
In calculating the results, we did make adjustments based on:
- Emission factor for electricity supplied to the data center
- The ratio of new versus returning visitors
- The volume of data transmitted from each website or service
Digital service carbon footprint
Here are the estimated carbon dioxide-equivalent (CO2e) emissions associated with our digital services over the last 12 months (Aug 1 2021 - July 31 2022):
| Service | Annual emissions (kg CO2e) | Carbon intensity (g CO2e/request) |
|---|---|---|
| DNS | 110 | 5.92E-11 |
| Registry service | 80 | 0.026 |
| go.eco | 110 | 0.006 |
| profiles.eco | 111 | 0.003 |
| bigroom.eco | 17 | 0.0009 |
| ecolabelindex.com | 157 | 0.005 |
| Total | 585 |
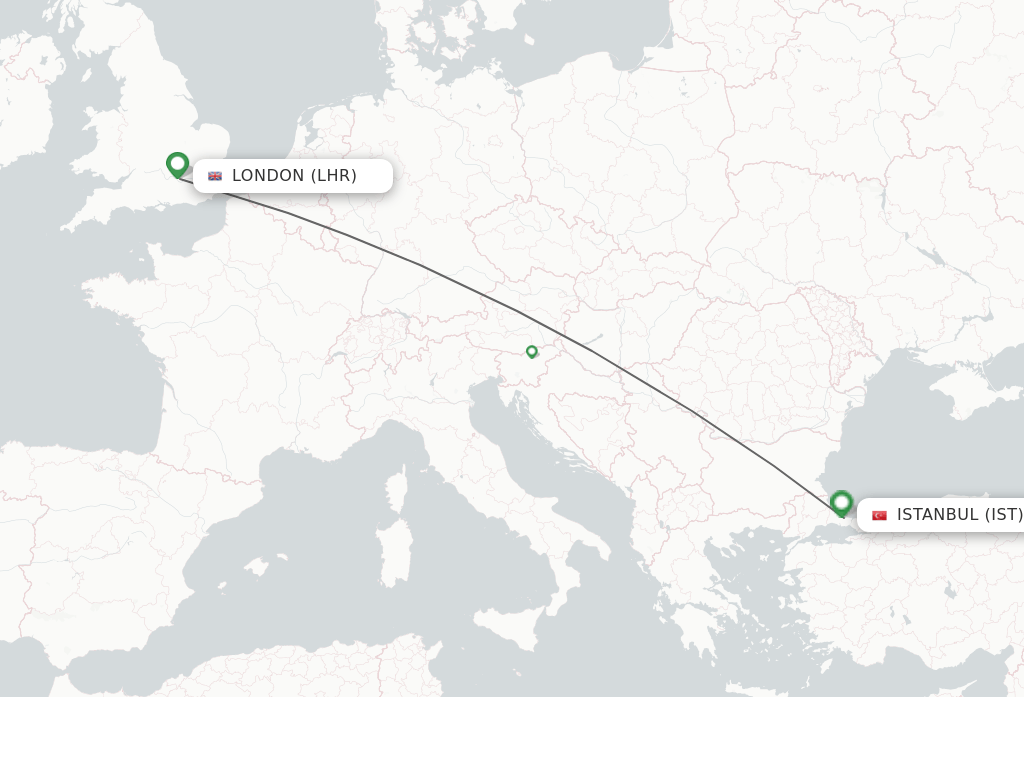
To put the total emissions in context, 0.58 metric tonnes of CO2e is equivalent to the emissions of driving a standard gasoline-powered vehicle 2,300 kilometers or of an economy passenger on an airline flight from London to Istanbul.
What’s next
Going through the process of calculating our carbon footprint has exposed a tonne (excuse the pun!) of ways we can reduce our emissions. Over the next few months, we will be taking action to reduce our footprint. We will write up the steps we’ve taken and the impact it has - so check back here to learn more.
We will also purchase offsets for those emissions that we won’t be able to eliminate. We will share information about which offset project we will support once we have selected it.
Moreover, there are a number of things that were not in scope for this assessment such as emissions from:
- our home offices
- work-related travel (there hasn’t been much during the COVID-19 pandemic)
- office productivity tooling and video conferencing software
- other software services in our supply chain
We will work to expand what’s included in Scope III for subsequent assessments in 2023 and beyond. Further extending the scope to account for more of supply chain emissions will further our journey to net zero.
If you have any thoughts, questions or feedback about our carbon footprint, we’d love to hear it. Please contact us via chat or email. If you belong to the .eco community and you are working on calculating your own carbon footprint, let us know - we’d love to share what you’ve learned with the community.