Putting our websites on a low carbon diet
How we reduced the carbon footprint of our websites by 40%

In October 2022, we set a goal of reducing our carbon footprint by 4%. Our plan was to achieve this target largely by optimizing the efficiency of the websites that we operate by running the .eco domain registry.
4% may not seem like a lot, but this represents 4% of our total estimated Scope 1, 2 and 3 emissions. Digital services represent only 10% of our overall footprint. So a 4% overall reduction meant a 40% reduction in the footprint of our digital services. Moreover, we don’t directly control all of the digital services that we use, so we could only make meaningful reductions to some of these.
Fortunately, we had identified some low hanging fruit that gave us confidence that we could hit this target. This article goes into detail about what we did.
We focus on 3 key areas in this optimization work:
For each section, we describe the optimization techniques we considered, detail the steps we took and estimate the impact and effort associated with those actions.
Note: this article is more technical than what we typically publish here. It is targeted primarily at web developers and designers. If you have any questions about the content, just ask. We’re happy to clarify.
Feel free to jump to a specific area of interest or just go through the content from top to bottom. But first, we need to explain how we’re estimating the carbon footprint of our digital services in the first place.
Calculating the carbon footprint of a website
To estimate the carbon footprint of our digital services, we followed the Sustainable Web Design methodology. This approach uses data transfer, the bytes sent back and forth between a visitor’s web browser and the web server, as a proxy for the energy required to run a website. Carbon dioxide emissions (CO2e) are derived from the carbon intensity of the electricity generated where the data is served or consumed.
Like all proxy measures, data transfer is an imperfect metric. It has, however, several advantages:
- It is correlated with energy consumption. It is easy to see how processing web requests consumes power on the servers and devices serving a website. Handling more requests with larger payloads will typically consume more power than fewer requests with smaller payloads.
- It is easy to obtain. Most web servers and content delivery networks (CDNs) record the volume of data that they transmit. Actual power consumption data is not (currently) broadly available - either for hosted services or from web browsers, so a suitable proxy is needed.
- It is actionable. As a technologist, there’s a lot we can do to optimize the volume of data transferred from our web properties.
- It is expansive in scope. It allows us to extend the boundary of our footprint to include not just the infrastructure that we use, but also include the network that transmits data to our visitors and the power consumption on their devices.
- It is better than alternatives. Commonly, expenses (money spent) is used as a proxy for estimating the carbon footprint of third party goods and services where energy use is unknown. However, cost is less clearly correlated with power consumption. It is really only correlated when energy consumption is a significant driver of the price of a service.
Using data transfer as a proxy can be counterintuitive. In general, it’s best to recognize that it is an imperfect measure and swap it with more appropriate alternatives when they exist. The Sustainable Web Design method does allow for substituting components of the estimation when necessary.
Data center
Data center location
When we were getting ready to launch .eco 7 years ago, we settled on a data center in Ohio, USA that offered good connectivity at a decent price. At that time, we didn’t give much thought to the climate impact of our digital infrastructure.
Unfortunately, as it turns out, Ohio is largely powered by coal and natural gas. In 2022, 396g of CO2e was emitted for every kilowatt generated. That’s pretty bad – though there are places in the US that are worse.
In 2022, as we started to think more about our own climate impact, we chose to move the infrastructure we manage to data centers in Quebec, Canada. Electricity in Quebec, in contrast, is generated entirely using hydroelectric dams. The carbon intensity of electricity there is only 1.7 g of CO2 per kilowatt hour. This represents a 200 times reduction in our data center carbon footprint.

Some data center operators in places like Ohio say that they use renewable energy, but that claim is typically based on purchasing Renewable Energy Certificates (RECs). This means that they are paying for electricity to be generated from renewables elsewhere, but they are still drawing electricity from the local grid which produces the associated emissions.
Fortunately, we were in a position to move our infrastructure. This was not an easy move. It took several months of effort to move the main pieces of infrastructure and it meant running across multiple regions for a period of time.
Most of this migration happened in mid-2022 and so it did not factor into our 2023 footprint reduction target.
Servers
One seemingly simple option for reducing emissions (and cost!) is shutting down servers that aren’t needed. For larger organizations with more teams and IT systems, there are often things left running unnecessarily. For us as a small team, we were already pretty focused on minimizing our hosting costs and only running what was needed so there wasn’t much we could just turn off.
We did find there can be a tension between necessity and resiliency:
- Do you need to be running a secondary database instance to failover to if there’s a failure with the primary? That secondary instance may be sitting idle other than processing transaction logs, but for the sake of resiliency, it’s pretty critical infrastructure.
- How closely should a test environment mirror the production environment? Can it have less redundancy or run on less powerful hardware at the risk of not adequately reflecting production? Does the test environment need to run 24x7?
For us, we were able to reduce our server footprint slightly - mainly by shrinking our test environments. But the impact wasn’t significant.
Another thing worth considering is the efficiency of server hardware. ARM chipsets are generally more energy efficient than x86 and have lower cooling requirements. This is why they’re used in smart phones and other portable devices that rely on having a long battery life. Getting precise differences in efficiency depends on the specific chips being compared and the underlying task performed by the servers. It’s safe to say that they’re less than 2x as energy efficient, meaning it will be at most a 50% reduction in emissions. The other thing worth considering is that the embedded emissions from manufacturing the server hardware is generally greater than the emissions associated with its use. So extending hardware life could lead to a lower footprint.
As the Sustainable Web Design method is concerned principally with data transfer, any improvements in infrastructure size or efficiency are not directly accounted for in the model. The model does allow for swapping the data center component of the model or alternately use a different model.
Serverless
Serverless represents the current pinnacle in the progression of virtualization technologies. With serverless, an application is only active and consuming energy for the duration of processing a transaction instead of sitting idle waiting for requests to arrive. It allows cloud providers to optimize the utilization of their underlying infrastructure across a large number of customers. This means that the embedded emissions and energy use of the hardware are amortized optimally and appropriately by use.
When we started building the websites and services used by .eco, serverless was a pretty nascent technology. Tooling was immature and the latency associated with serverless execution was a consideration. These have now improved and it’s feasible to build performant applications entirely on serverless.
Currently, we do use serverless functions and services throughout our systems and our architectural direction is to use serverless for all new systems that we build.
While not typically considered serverless, most of our websites are statically generated. This means that pages are served directly from static file storage via a CDN (Content Delivery Network). There is no underlying content management system or database. Like with serverless, the use of the underlying hardware is spread across many customers and our use is circumscribed to requests for our website assets.
Requests
Trying to reduce the number of requests to a website seems counterintuitive. Most businesses, nonprofits or individuals build a website to try to reach as many people as possible. We treat the growth in visitors over time as a measure of our success. Why would we want to do anything to suppress that?
Bots
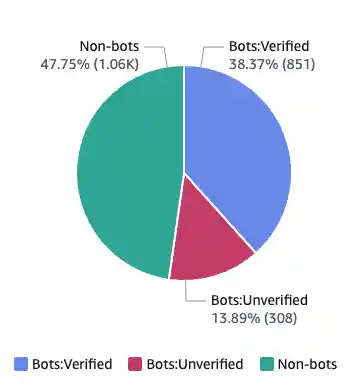
Well, as we know, not all visits to a website are of equal value. In fact, for most modestly successful websites, a good chunk of those visits are from bots, not people (over 30% by some recent estimates). Some bots are useful as they get our site indexed on search engines. However, many bots have malicious intent, probing for security vulnerabilities or just scraping site content. The recent explosion of generative AI models has led to a proliferation of bots that are appropriating content to feed their models.
While much of this bot traffic is benign, every request puts load on web servers and back-end systems, generates unneeded Internet traffic and increases a website’s carbon footprint. Unfortunately, blocking these bots is not as easy as updating the robots.txt file. Poorly mannered bots will just ignore it.
The best way to block these bots is using the capabilities of a web application firewall (WAF). Many CDNs have built-in WAF capabilities. Detecting bots is not easy, so the best bet is to use the bot-blocking capabilities provided by the WAF. These bot blocking services may have an additional cost.
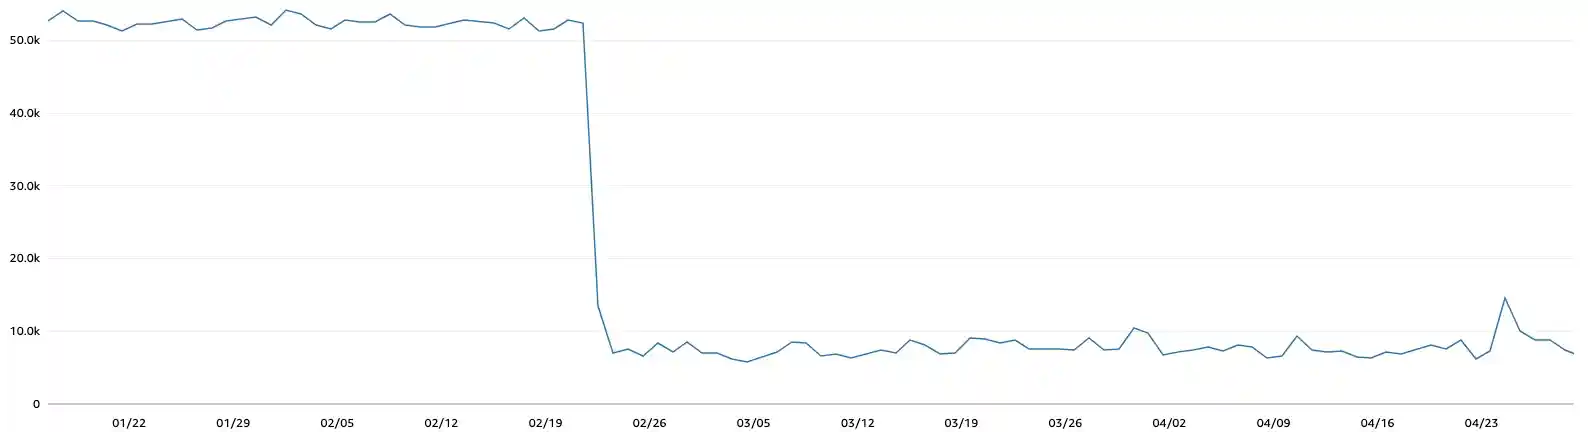
We have found for our websites that WAF bot blocking reduced traffic by over 50% in some cases, though this can vary over time. Note that the drop in bot traffic may not be visible in your web analytics dashboards. Most analytics tools rely on running javascript to record visits and most of these bots do not execute JS. Also be aware that bot blocking may have the side effect of also blocking API traffic. So it is best to handle API traffic from a different endpoint to avoid disruption.
A cheaper and more basic option is to configure a WAF rule to limit the number of requests from a single IP. This will slow down bots that are trying to probe your site from a few IPs. This will also protect your backend systems from getting overloaded due to some denial of service attacks.
Probes
Not all bot traffic is generated by unfriendly third parties. As we discovered, a good portion of synthetic traffic to our websites was generated by services that we were using to check the health of our digital services. These probes check your site from a variety of locations around the world to verify that your website is up and reachable. It’s incredibly valuable for us to know if there’s an issue with any of our digital services as soon as possible so that we can respond accordingly.
What we didn’t realize until we started digging is that these health checks were responsible for a large number of requests every second 24x7. This was more fidelity than we needed and we were fine reducing the frequency of the health checks and removing health checks from services that we did not need to be notified about. Adjusting our probes reduced the requests to some of our sites by 85% and data transfer by 67%.
Caching
Another great way to reduce the number of requests to a website is to make extensive use of caching. If the content hasn’t changed, there’s no need for it to be downloaded again.
The most common way to do this is with HTTP cache headers. These headers provide instructions as to how long the content can be cached. Static asset files, like images and fonts, are large and don’t or shouldn’t change. They are well suited to be cached for a long time.
If you’re using a CDN, cache headers can also be used to reduce the number of requests to your origin servers and specify how long the content should be cached by the CDN.
Even API calls can be cached. We added short-lived cache headers to a number of our API calls. Often the same API endpoint can be called multiple times as a user navigates the website. As long as the responses of those APIs don’t change frequently or meaningfully, the responses can be safely cached.
Requests per page
Every webpage or web application makes several requests from the visitor’s browser to the server. There is the initial load of the page content (the HTML) and then a subsequent request to load each image, stylesheet, script file and more that is required to render the full page in the browser.
Each HTTP request needs to send several messages back and forth to establish a connection between the browser and the server. While this overhead is low (the data transfer is small), it does add up especially as, according to the 2022 Web Almanac, the median web page makes 76 requests.
The overhead of each request is mitigated by using HTTP/2 which multiplexes multiple requests over the same HTTP connection. Our web applications already made full use of HTTP/2, but it is worthwhile verifying that this is the case.
Each request to a different origin does require establishing a distinct HTTP connection. So it can be beneficial to reduce the number of different domains that you need to connect to to render your website. We did some work to eliminate or consolidate origins to reduce them to a minimum.
Content
The next big area of optimization is content. This is also counterintuitive as visitors coming to your website are there to engage and interact with the content that you provide. However, there are many ways that content can be streamlined without impacting the visitor’s experience.
We considered 4 different types of content and how they can be optimized.
Images
Images tend to make up the majority of data transferred for most websites. According to the 2022 Web Almanac, images account for 50%-70% of the data transfer. For some of our webpages, images made up almost 90% of data transferred. So optimizing images was a good place to start.
When optimizing images there’s a few different angles to consider:
- Image format
- Image compression
- Image size
- Lazy loading
Image format
A lot has changed since the early days of the Internet. Modern image formats, such as .webp and .avif offer better compression with better quality than earlier formats like .png and are now well supported by web browsers. Newer formats, like JPEG-XL, are promising even better compression with fast lossless or lossy encoding, but support across all major browsers is still lacking.
When choosing the right image format, it’s important to consider the type of image being rendered. Webp is a great format for photographs. For icons or logos, SVGs are typically much smaller and are the best option. As they are vector-based, they have the advantage of being able to scale to any size, can be easily recolored or even animated. We wrote a whole article on why you should use SVGs for your logo – so check that out for more information.
For our websites, we swapped PNG logos or icons with SVGs wherever possible. We also converted all other images to .webp, applying compression to ensure that the images were as small as possible.
We used a library called sharp to help automated image conversion and compression. Automating this process makes it considerably easy to maintain.
Image compression
It's typically not necessary to show a high definition image on a web page when it's likely to be viewed on a mobile phone screen and quickly scrolled past. Binary image formats are highly amenable to compression – effectively reducing the fidelity of the image in exchange for a smaller file size. Often files can be shrunk by 50% or more without any visibile loss in image quality – especially when using modern image formats.

Even SVGs can be compressed by stripping out whitespace and unnecessary declarations. Tools like SVGO make this easy to do and automate.
To help guide this optimization work, we set a target maximum image size of 60kb or less. Having a heuristic to follow made it easier to determine when the optimization was good enough.
Image size
It can be difficult to determine what the appropriate dimensions are for rendering an image on a web page. The image may scale with the size of the browser window or the device used. Modern screens use higher pixel density (so called “retina displays”) than older ones. It’s very easy just to opt for the largest conceivable image size and be done with it.
Modern browsers support the picture element that allows for specifying different images at different resolutions. However, this can complicate things as there are now multiple versions of the image to manage and optimize.
We came to the realization that most images on our site are for visual interest, but are not informational. Most visitors glance at them and move on to the content. As a result, we were content to accept smaller, more highly optimized images at some visible loss of image quality.
Note that it's best to ensure that images are resized appropriately before they are compressed to obtain the best compression results with the least degradation in quality.
Lazy loading
By default, the browser will attempt to download any image on the page. This behaviour can be altered by using the loading attribute on img elements instructing the browser to only request the image if it is currently visible on the screen. Most of the time, especially for longer pieces of content (like this one!), visitors do not view all the content before bouncing or navigating elsewhere. Lazy loading ensures that these image assets aren't loaded unnecessarily.
Unfortunately, this only works for images loaded via the img element. If the image is loaded via CSS, it will be loaded automatically. One way around this is to migrate images from stylesheets into the HTML. This may require reworking the HTML somewhat as the behavior of background images is a bit different from inline images. There are also Javascript libraries that support lazily loading background images.
Javascript
After images, Javascript is typically the second largest type of resource used on a web page. According to the Web Almanac, the median website requires 481 kb of Javascript. Of that, around 37% is often unused.
What makes Javascript have an outsized impact is that it is CPU-intensive to parse and execute. This increases power draw and drains the battery of the device rendering the page, thereby increasing electricty use and associated emissions. Even that unused Javascript has an impact as the browser still has to parse and interpret it.
Most websites rely on Javascript frameworks and libraries. These libraries typically contain more functionality than what is used on a given site. This is the case for us as we make use of Bootstrap on our websites but use only a fraction of what Bootstrap has to offer.
It can be tricky to identify what Javascript is unused and even harder to strip it out. Ideally JS libraries would be modular and could be easily unbundled and repackaged, but that's not often the case – especially for older frameworks. Even where it is possible, building custom bundles can be complex as it requires understanding the build and packaging process for those libraries. We still have more work to do in this area.
One thing that we have done is move to smaller Javascript packages for our custom JS code on some sites by only loading what is required for a specific page. This is in contrast to previous best practice that recommended initially downloading all the scripts required by the site so that they could be cached and wouldn't need to be redownloaded. However, this made the initial site visit slow and meant that larger bundle would need to be re-interpreted for every page visit, regardless of whether the functionality was needed or not.
CSS
CSS suffers from many of the same problems as Javascript, with the Web Alamanc estimating that upwards of 76% of CSS is unused on the median website. However, CSS tends to be much smaller with the median site downloading 68kb of stylesheets.
Like with Javascript, most websites use CSS frameworks that end up including more styles than are needed for a given site. Identifying and stripping out those styles can be tricky. There is tooling to support this, but it can be tedious work.
Newer CSS frameworks, like Tailwind CSS makes this much easier; but switching CSS frameworks for a medium-sized site is a lot of work. Experimenting switching from Bootstrap to a lightweight CSS framework is on our to do list.
Fonts
Web font hosting services, like Google Fonts, have made it easy to stylize the typography on a website with a wide range of fonts to choose from. However, aside from the privacy issues of using these services, they also increase the latency in rendering your site. Font files can be large – and font hosting services may require multiple requests to load your font files. For example, Google Fonts loads a Javascript file and a CSS file before loading the font files. Your site may also break in unexpected ways if the font hosting service is unavailable.
One way around this is to self-host the font files on your web servers. This can reduce requests and ensures that font files are downloaded within an existing HTTP connection.
An even better option is to minimize the use of web fonts. There is already a great collection of fonts available on most operating systems that can be used in the browser. These fonts will load almost instantly as they don't need to be downloaded across the Internet. This can be especially effective for body copy as it will appear quickly and will render in a font that is already familiar to the visitor. Designers have put together some good collections of system fonts that will look good cross-platform.
We have moved to self-hosting our web fonts and reduced the number of fonts we're using. We are experimenting with using system fonts for our sites.
Conclusion
This wraps up a pretty deep dive of the work that we've been doing to optimize the websites we use to operate .eco. The main thing that we want to underscore is that this is a journey, not a destination. We are continuing to find ways to further optimize our websites. If you have suggestions of things we can do to improve, please let us know.
And if you are a member of the .eco community on a similar journey, we'd love to hear from you. We're happy to exchange suggestions on what else we can do to collectively reduce our digital carbon footprint.